


An introductory example
In 1936, the Johnson Wax Company contracted Frank Lloyd Wright for designing their new headquarters. The architect presented an extremely innovative project for the age: some umbrella-like columns (nenufars, they called) with just 22 cm in the base and 5.5 m on the top.

The property, worried by the security of the construction, decided to make an stress test. They decided to test not for the 6 tons the column had to support but for twice this value. The architect agreed and suggested a public test.
Testing the nenufar
When the test showed a perfect behavior at 12 tons, the architect ordered to increase the load. To make the story short, the columns collapsed when they were loaded with 60 tons, ten times more the effort they calculated they had to support in the building! For sure, they were calculated for this load.
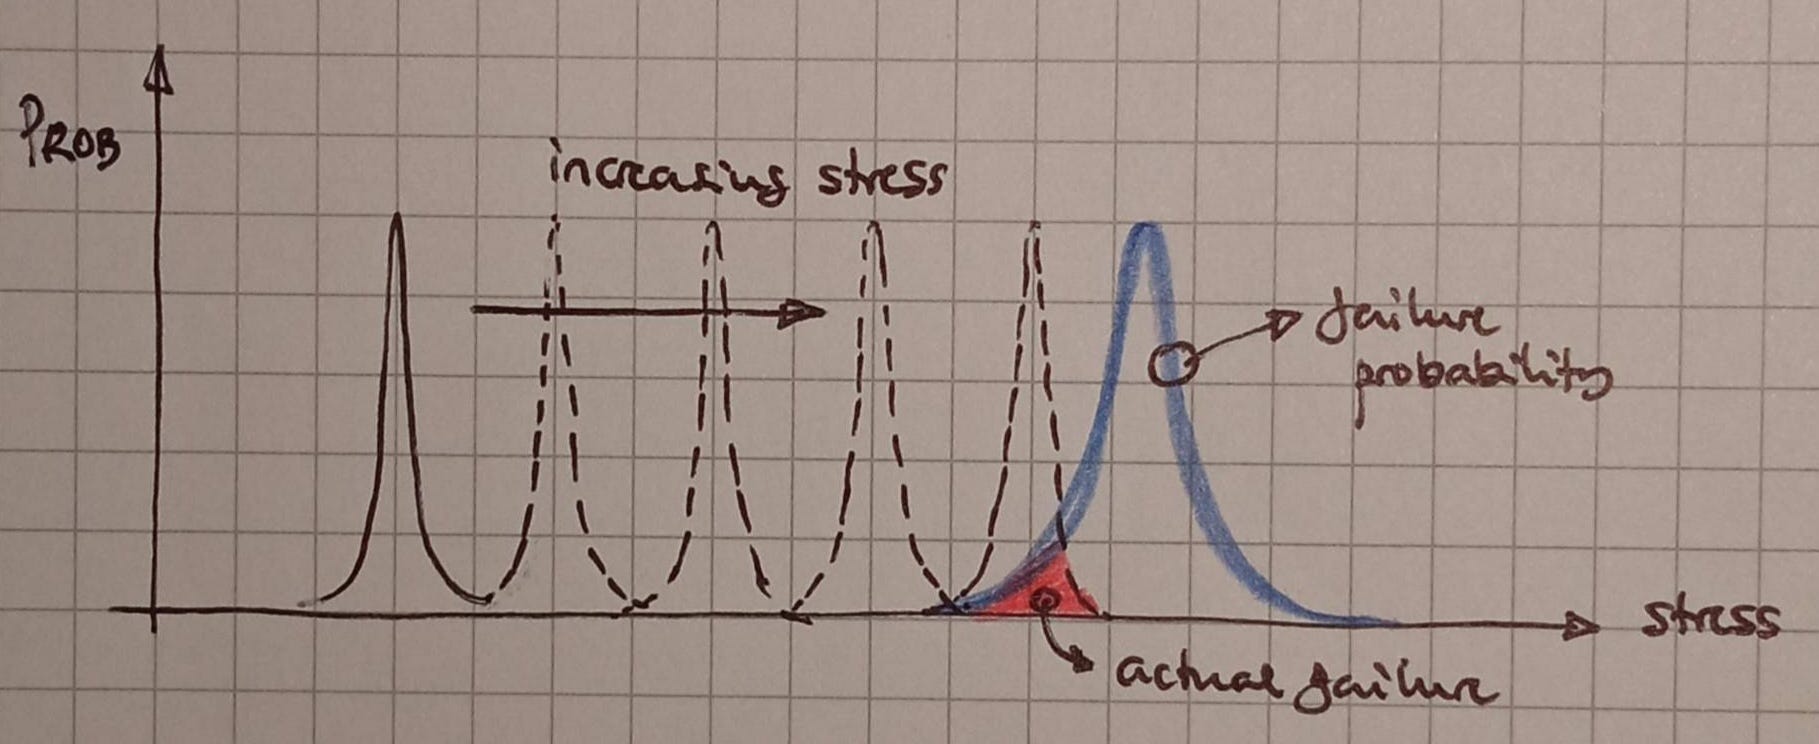
What does this example tells us? We can draw a graph in which the horizontal axis is the stress (the weight) and the vertical axis is the normalized probability of occurrence across long time. This probability is not symmetrical. Most of time the stress is its own weight plus the roof (6 tons). It may happen that there is a strong wind that increases the stress, but its probability decreases as the stress grows.
We could also draw in red color the failure probability. This plot is likely to have a gaussian-like distribution. Not every nenufar will collapse at exactly the same stress: depending on the exact concrete ratio of stone, cement and sand, the temperature during concrete hardening and other factors some variability is expected between different instances. We could think that the average failure probability is somewhere close to 60 tons.
Now, what happens in real life? Let us think in what we see when walking through the forest: we can observe a broken branch of a tree or even the whole tree. This is the combination of extreme stress condition (an strong wind or heavy snow weight) and a particular sample whose structural strength is lower. Across long time and a very large number of trees, the failure is easily observable. We can see it in the next figure.
Making things to fail to reveal weakness
In our historical example, we saw a test that consisted in increasing the stress until the failure took place and they did it with a single sample. While with a single sample you cannot know neither the mean or standard deviation of the failure probability, it is not strictly needed. Take into account also that the stress is increased in coarse steps (sand bags). All they wanted to know is the order of magnitude of the columns robustness.
The test result generated a great confidence in the contractors. Quite reasonable as after almost ninety years after its construction, the building remains up!
HALT test
There are some companies (like HP) that use an stress test to improve robustness of the PCAs they design. Such test is called in very different ways, while one of the most successful is HALT, Highly Accelerated Life Test.
I needed to change my mind when exposed to it. When running it, the stress is increased well over the operational point until the Device Under Test (DUT) fails. The objective of the test is to know the design weakest point and potentially further improve its strength. If there is no failure, there is no learning, but every weakness found in HALT, if corrected, is an opportunity for product reliability improvement.
I have been able to find in the literature that failure analysis reveals that the defects encountered during HALT tests are relevant and are likely cause of failures in the field (in customer hands) if not corrected. Said in other words: there is high correlation between failures detected during HALT execution and field failures. Many times (over a large installation base) the products are operated, stored or transported beyond specified operational limits or a worst case combination of them all (perfect storm alignment of worst case conditions).
HALT test can be used to significantly improve design and manufacturing reliability.
Take into account that in our building example description we considered just one source of stress (weight) but in practice there are many sources of them. In a typical PCA, the most significant stress source is heat, but not the only one. There are mechanical stress (vibration or thermal cycling), voltage, current (electromigration), etc. HALT exacerbates mechanical fatigue and forces failure modes to emerge by combining various stress sources.
Fundamentals of HALT
HALT test is useless if failures cannot be discovered when they arise. Thus, proper test requires good failure diagnostics.
Fault finding is not enough. When a failure arises, the engineer has to find the failure root cause and to decide if it has to be corrected or not. Sometimes the root cause is found to be a fundamental limit of the technology. Such things are very costly to improve if ever possible. An example of this is the operating temperature range of aluminum capacitors in a power supply unit.
HALTing electronic boards
The typical HALT test has four stages:
Cold ramp: with a typical range from -30 to -70 ºC in 10 ºC steps. Helps to identify which is the Low Operating Limit of the DUT.
Hot ramp: with a typical range from 30 to 150 ºC in 10 ºC steps. Helps to identify which is the High Operating Limit of the DUT.
Vibration ramp: up to 30 g in steps of 5 g. Vibration is random, 3-axis. Executed at ambient temperature. Great help to identify assembly problems.
Combined very fast temperature cycles between Low and High Operating Limits combined with a vibration ramp as before. Ideally, executed over two different samples.
Steps take typically 10 minutes and it is a must that full diagnostics can be executed at least once.
The Cold test is run first because it is less likely to damage the DUT. The Hot test can degrade the board (PCB material in particular). Because of that, it is recommended to use new PCAs for Vibration and Combined test (steps 3 and 4).
HALT test does not only stress the PCA: also does to the responsible engineer, that has to identify a failure in record time, because HALT chambers are extremely expensive.
Sometimes a failure is easy to identify like a thermal protection of a semiconductor device that could not be inhibited, sometimes a capacitor or a connector breaks down due to vibration. Sometimes the diagnostics detect a failure but the system continues working. If not, you have to reduce stress and see if the DUT recovers or not. If if does not recover, means that you have reached a Destruction Limit.
It is typical to add thermocouples to measure temperature in those components that are more expected to be hottest ones.
Operating limits
While HALT is not conceived for validating the DUT in the operational limits, it is also very true that it provides very useful information about this. In a robustly designed and manufactured product the Operation Limits should be outside the Operating Range with sufficient margin (16 ºC is a typical value that considers typical uncertainty in temperature measurements).
Summary and conclusions
The HALT environmental stress exacerbates design or processes weak links and allow to discover design and process flaws before the product reaches the customer hands as the defects are very likely to arise during stress test.
Every weakness found in HALT, if corrected, is an opportunity for product reliability improvement.
In the fundamentals of HALT is the capability to detect failures when they take place.
Annoying approach. Thank you.
Hi LuisMi, again I've enjoyed reading your weekly newsletter, It is obviously it has been written with wisdom and knowledge of the cause. Thank you for sharing your thoughts about electronics.